
MODULES
Dashboard · Indicators · Targets · Activities · Impact · Assistant · Report · Infographic
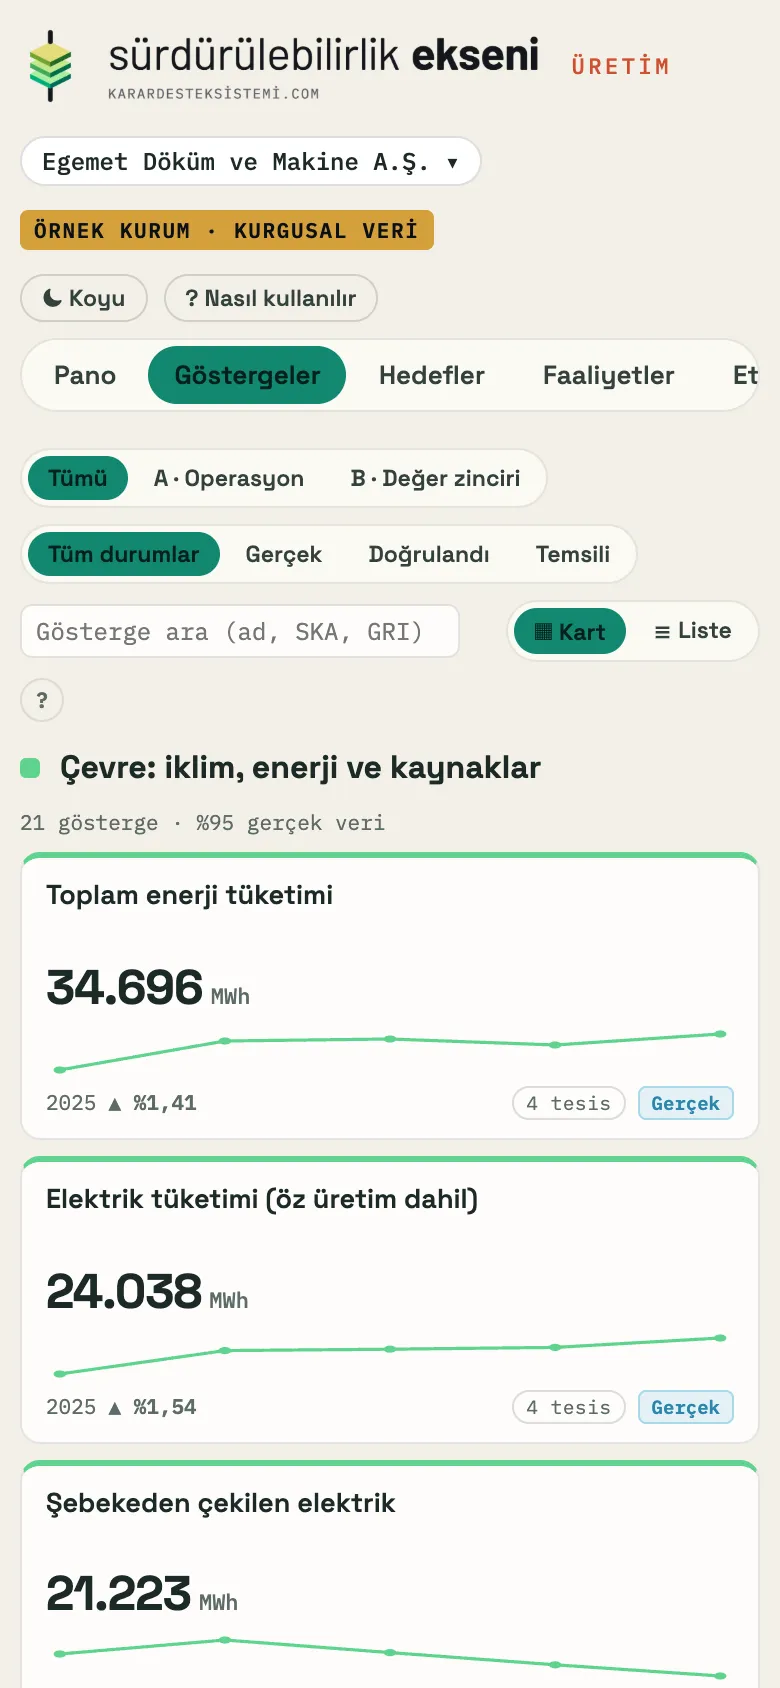
Indicators are grouped into environment, social, governance and organisation profile categories. Each value shows its source document and page, SDG and GRI code, trend over the years and breakdown by facility.
A status label shows what in the report is reliable and what is a placeholder: values entered with a source document are marked "Actual", checked and approved values "Verified", and placeholders that must be replaced "Representative".
Each target is linked to an indicator, to SDG sub-targets and to the relevant policy documents. The path drawn from the base year to the target year, together with any interim targets in the strategy, is compared with the latest actual value.
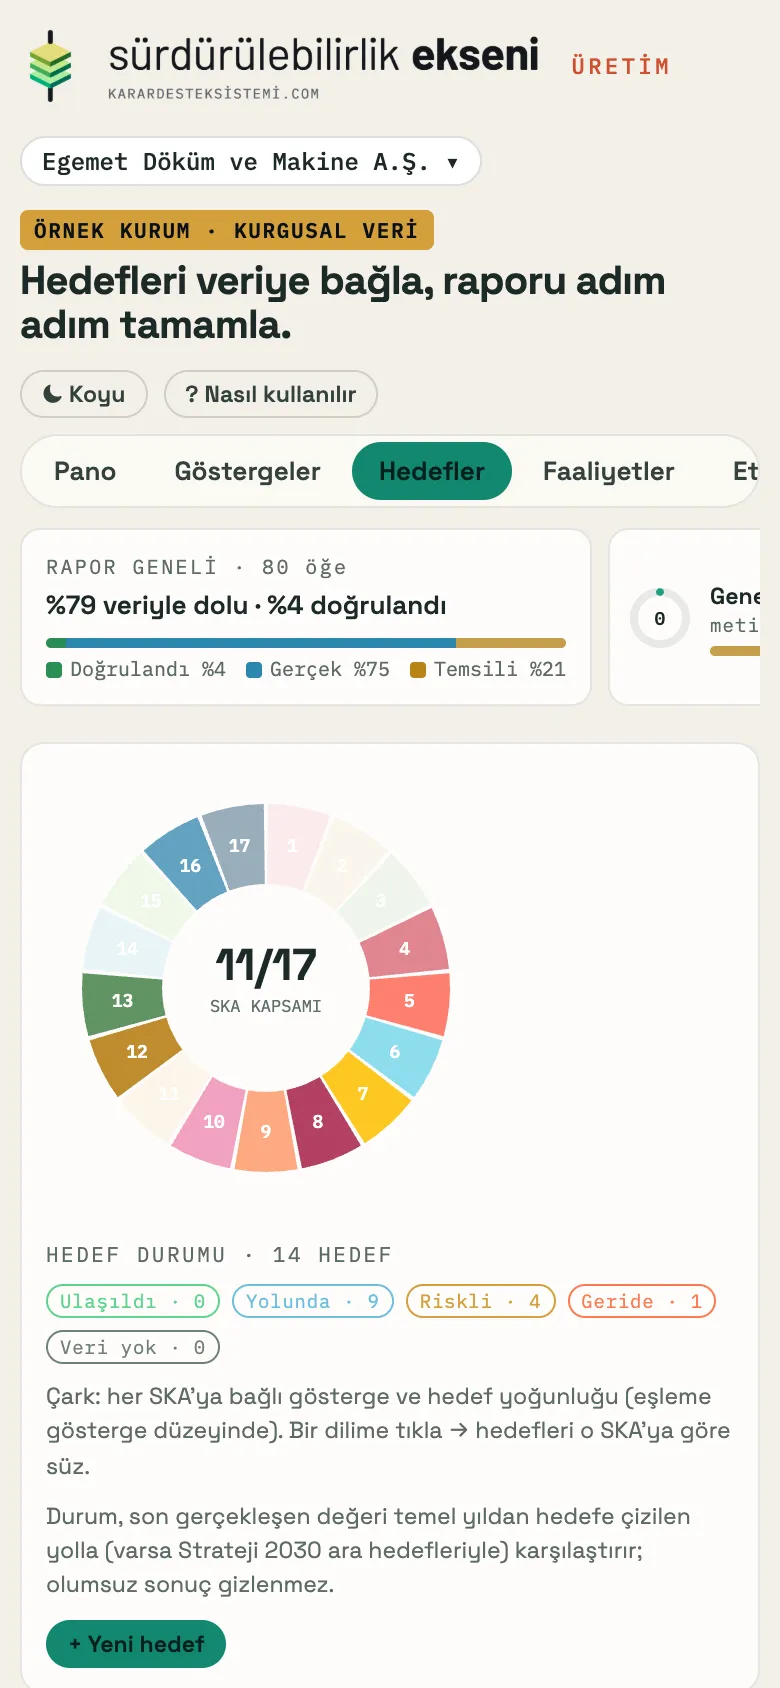
Targets are classed as "Achieved", "On track", "At risk", "Behind" or "No data"; the SDG wheel shows which goals are covered. Negative results are not hidden.
Every activity, such as a rooftop solar plant, waste-heat recovery or a training programme, is entered with its annual quantity, unit cost and unit impact. Activities are grouped under environment, social and governance.
The activity card shows at a glance which indicators it affects and which targets are measured by those indicators; quantities for later years are marked as planned.
The impact network traces the path from activity to indicator, target and SDG. On a carbon or cost axis, the total contribution of activities for the selected year is calculated, showing how much of the target gap it closes.
The same data can also be read as a matrix. New axes can be added from targets: energy, water, avoided waste, employees reached. The figures below belong to the application's fictional sample organisation.
The report consists of sections such as the executive message, highlights, boundaries, strategy, stakeholders and material topics, environment, social, governance, an SDG progress table and annexes. Each section's text, indicator table and figure are reviewed and approved separately; completion, data and quality scores are always visible.
"Complete the report" reviews every section and lists gaps such as the materiality matrix and balance as next steps; each run is kept as a report version. Outputs: the full report (A4 PDF), section PDFs, a component package and PNG / SVG figures.
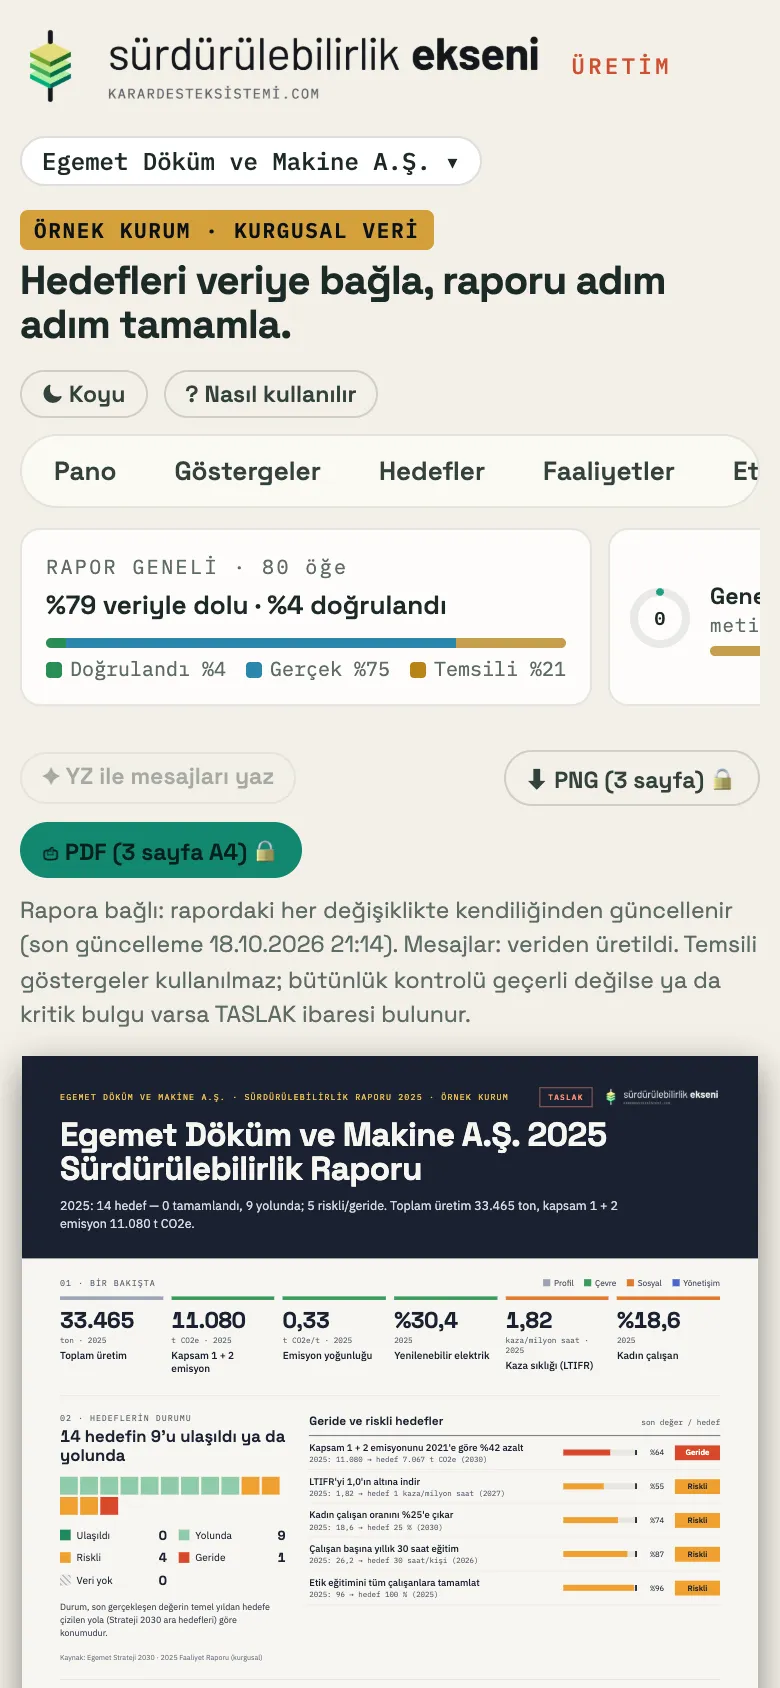
The three-page A4 infographic is linked to the report and updates automatically with every change: indicators at a glance, target status, targets that are behind or at risk, SDG coverage and the report's axes.
Representative indicators are not used in the infographic; if the integrity check has not passed, the page carries a "DRAFT" mark.
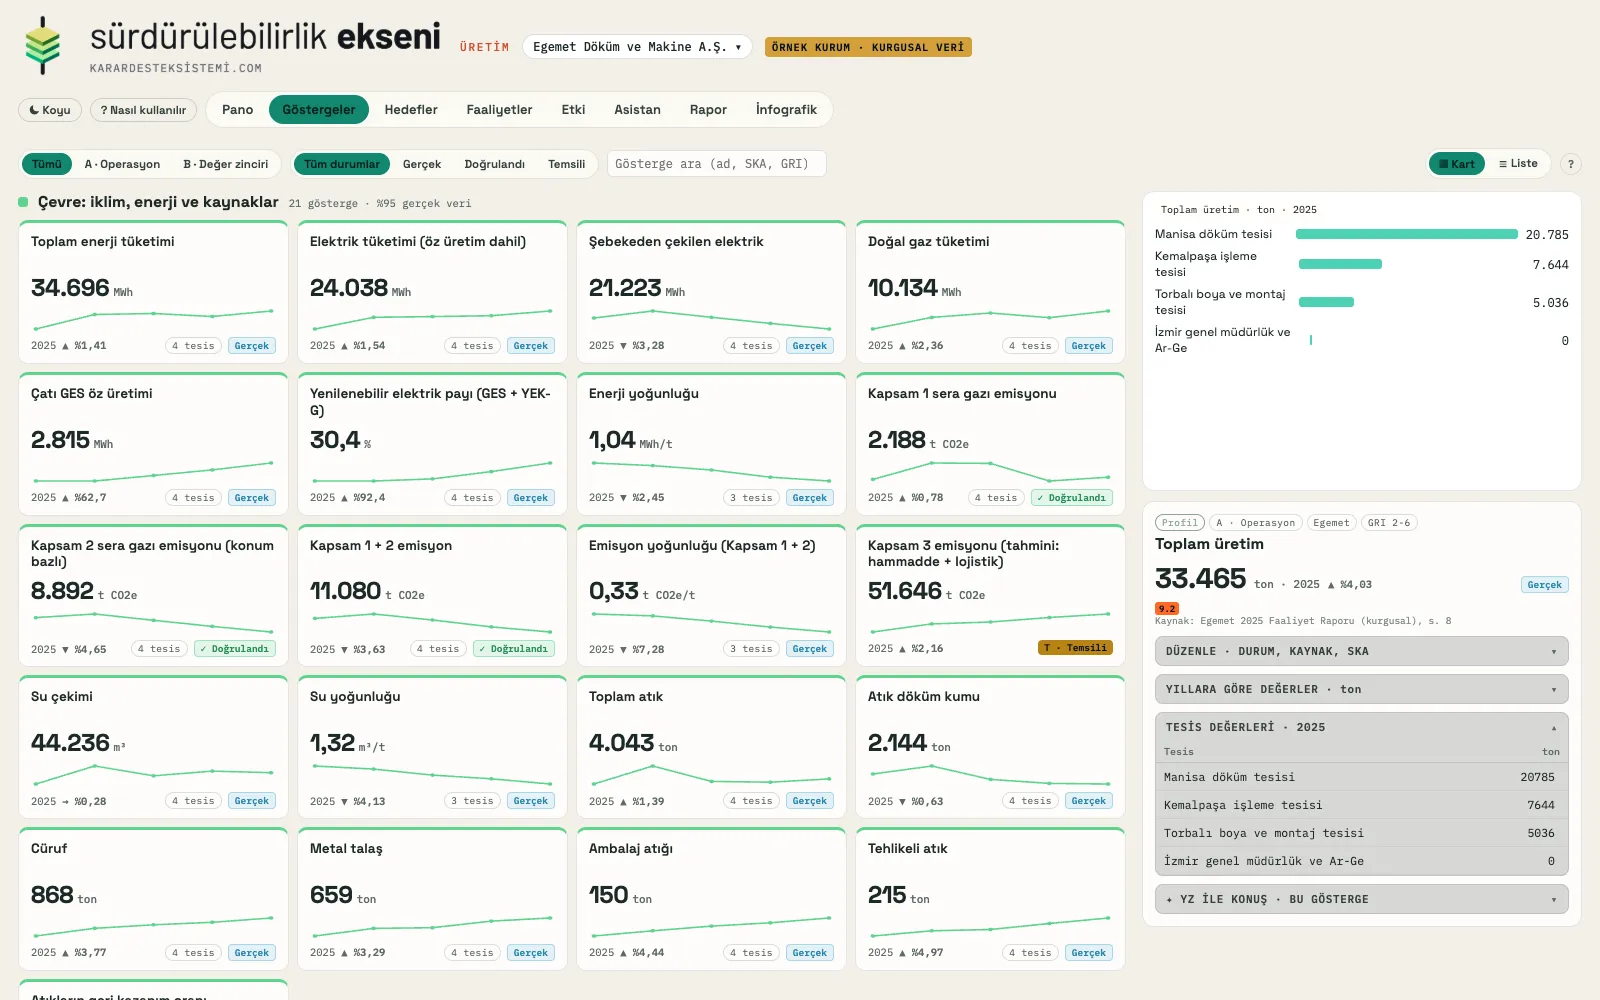
Category cards, trend line, facility breakdown; source and status label on every value.
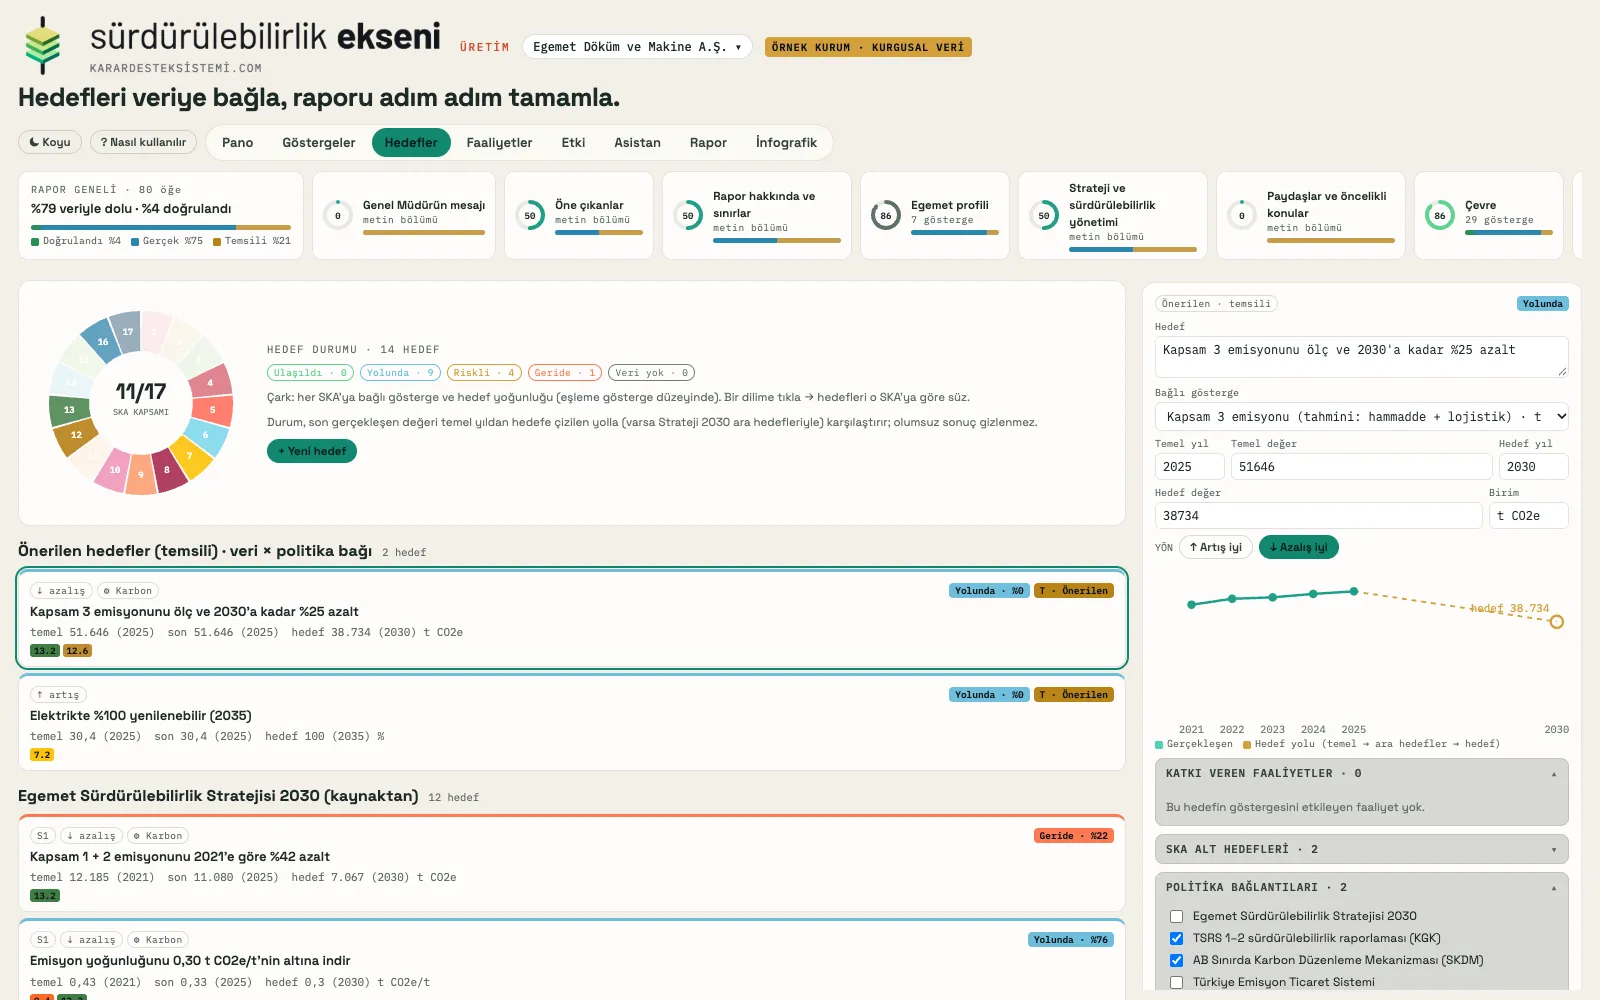
SDG wheel, target status counters, target path chart and policy links.
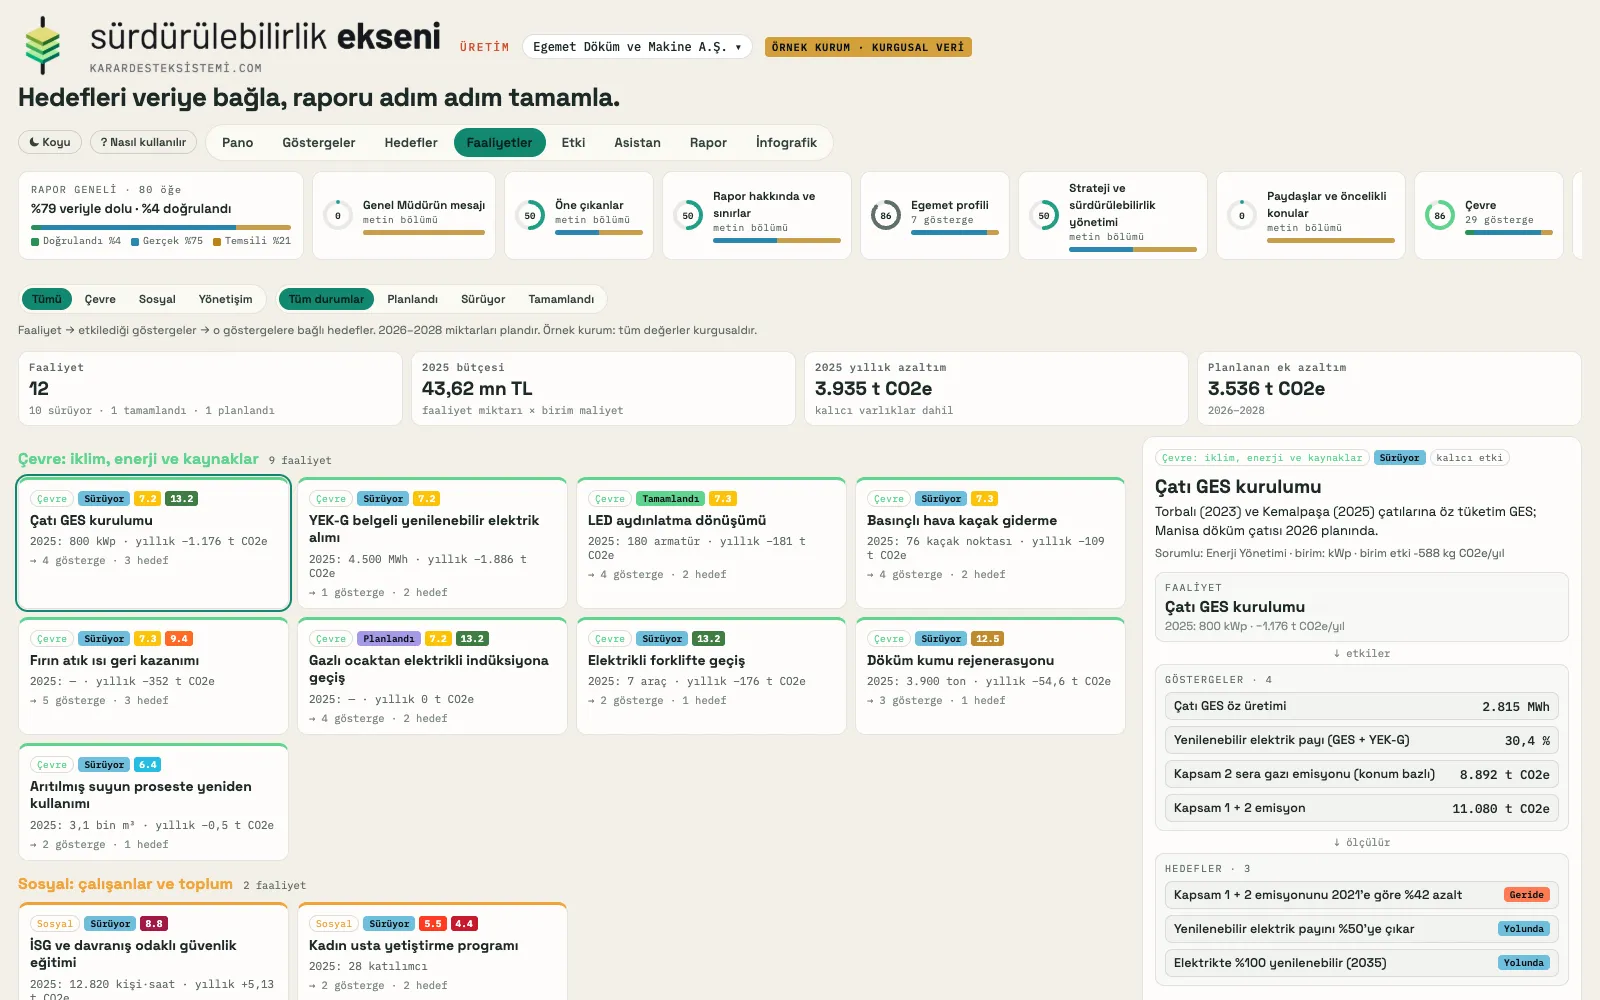
The indicators an activity affects and the targets measured by those indicators.
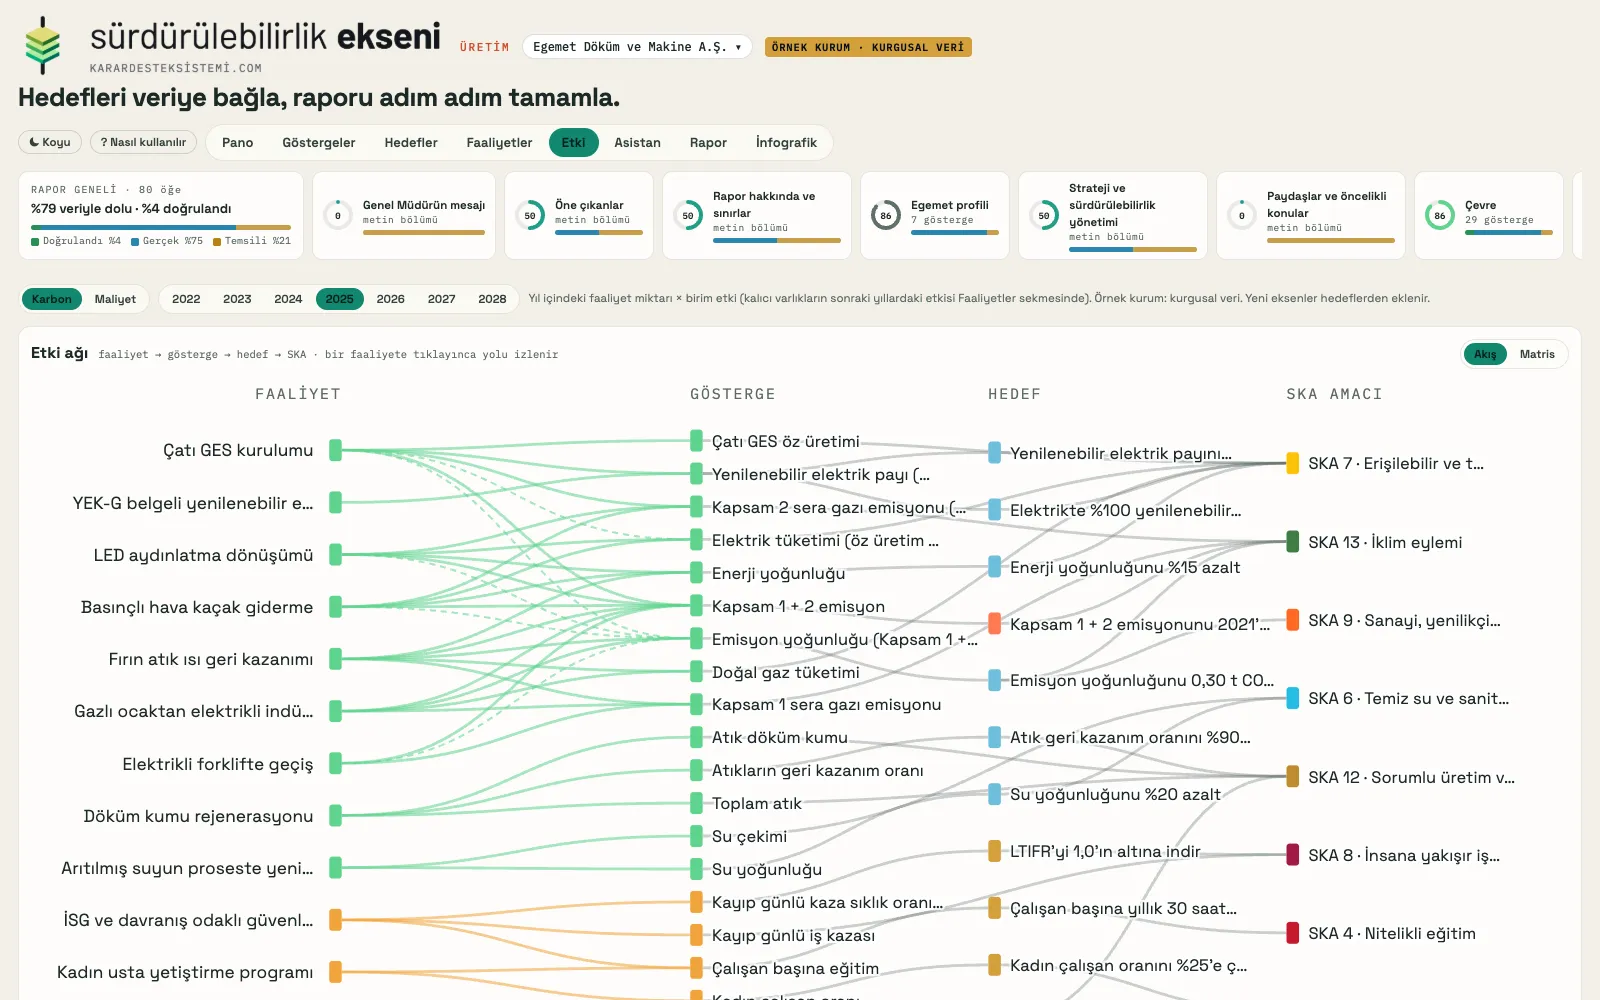
Activity → indicator → target → SDG flow, on a carbon or cost axis.
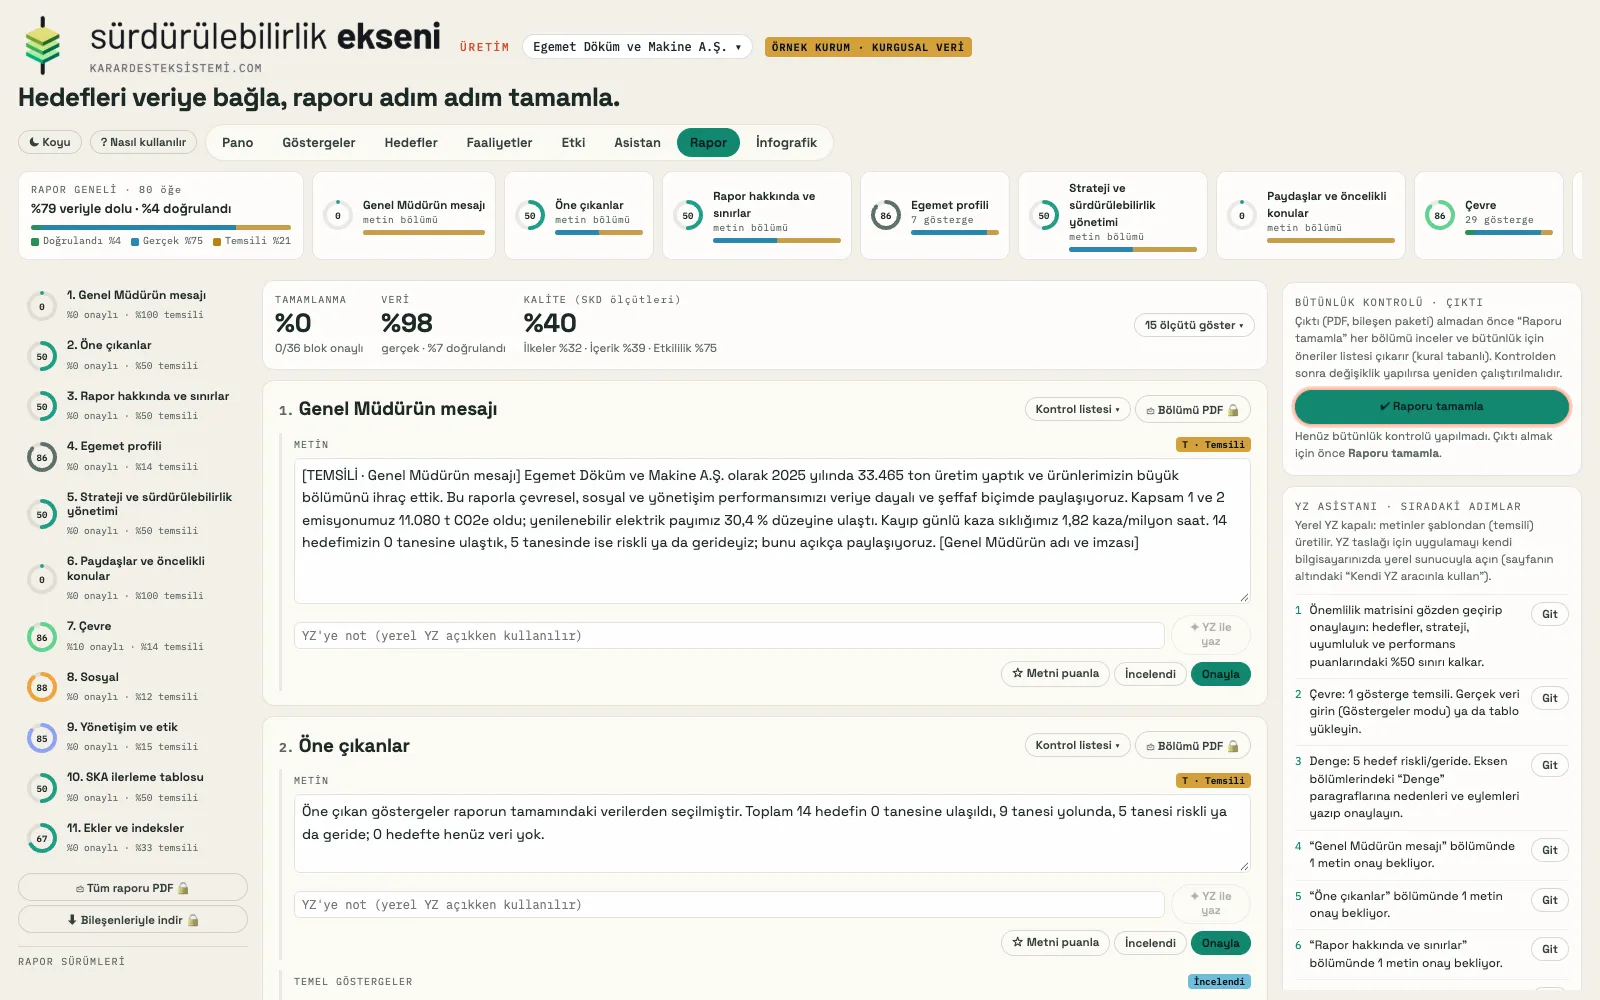
Section list, completion, data and quality score, integrity check.
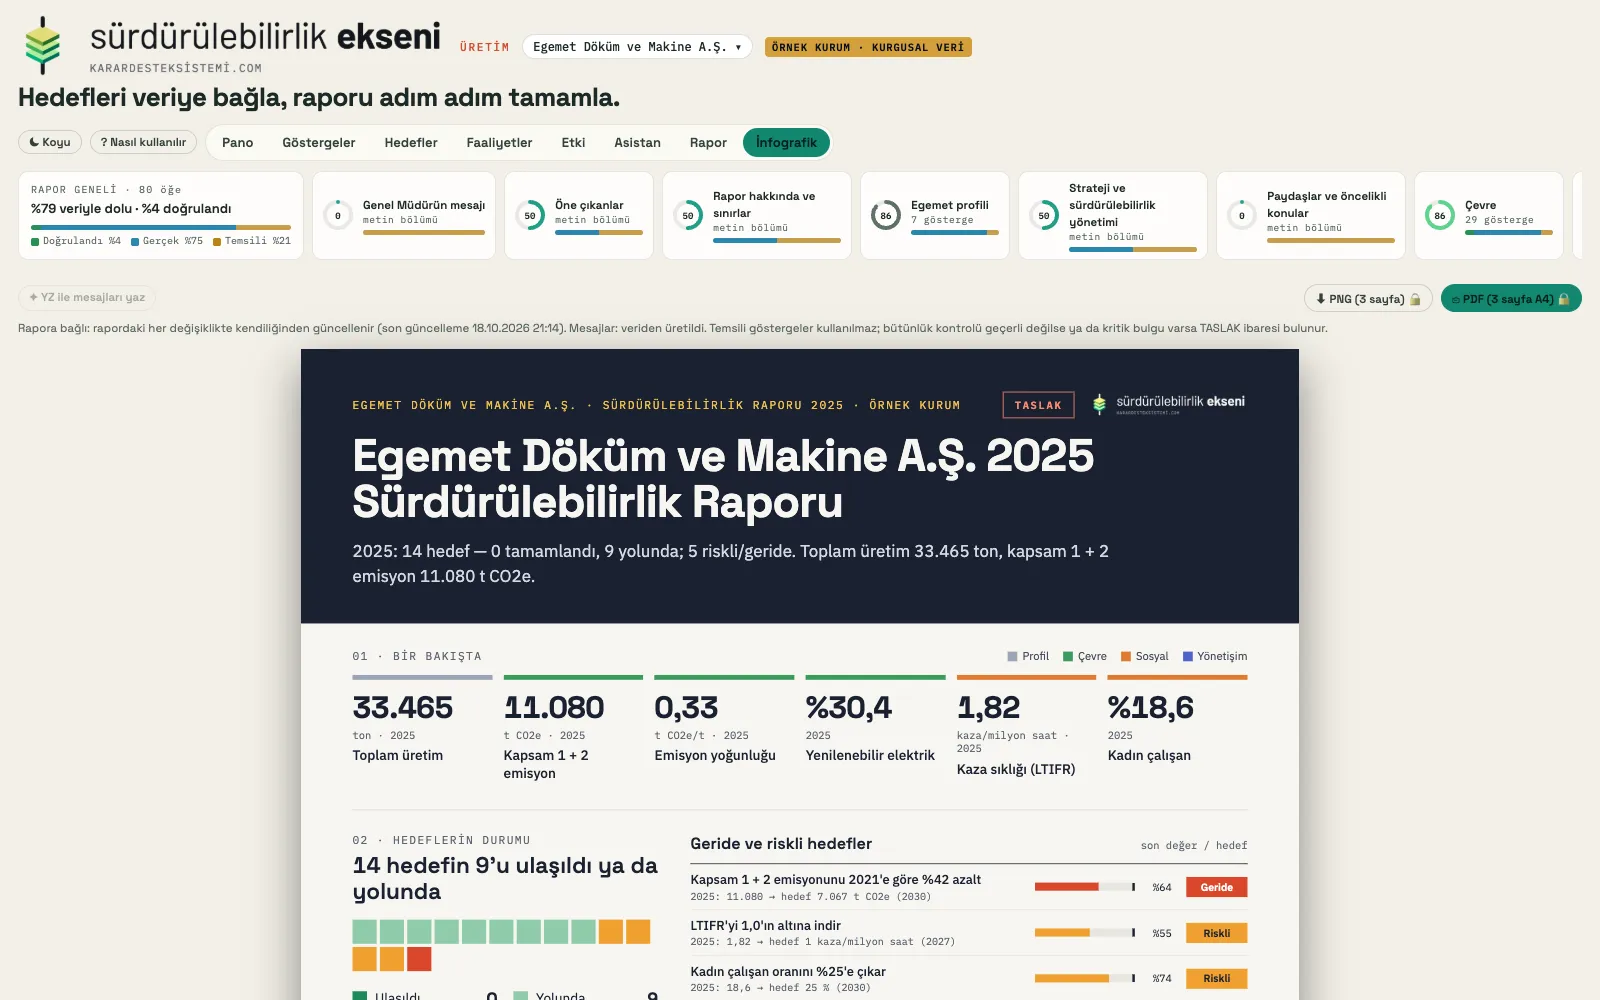
A three-page A4 summary linked to the report; marked "DRAFT" until the check is complete.
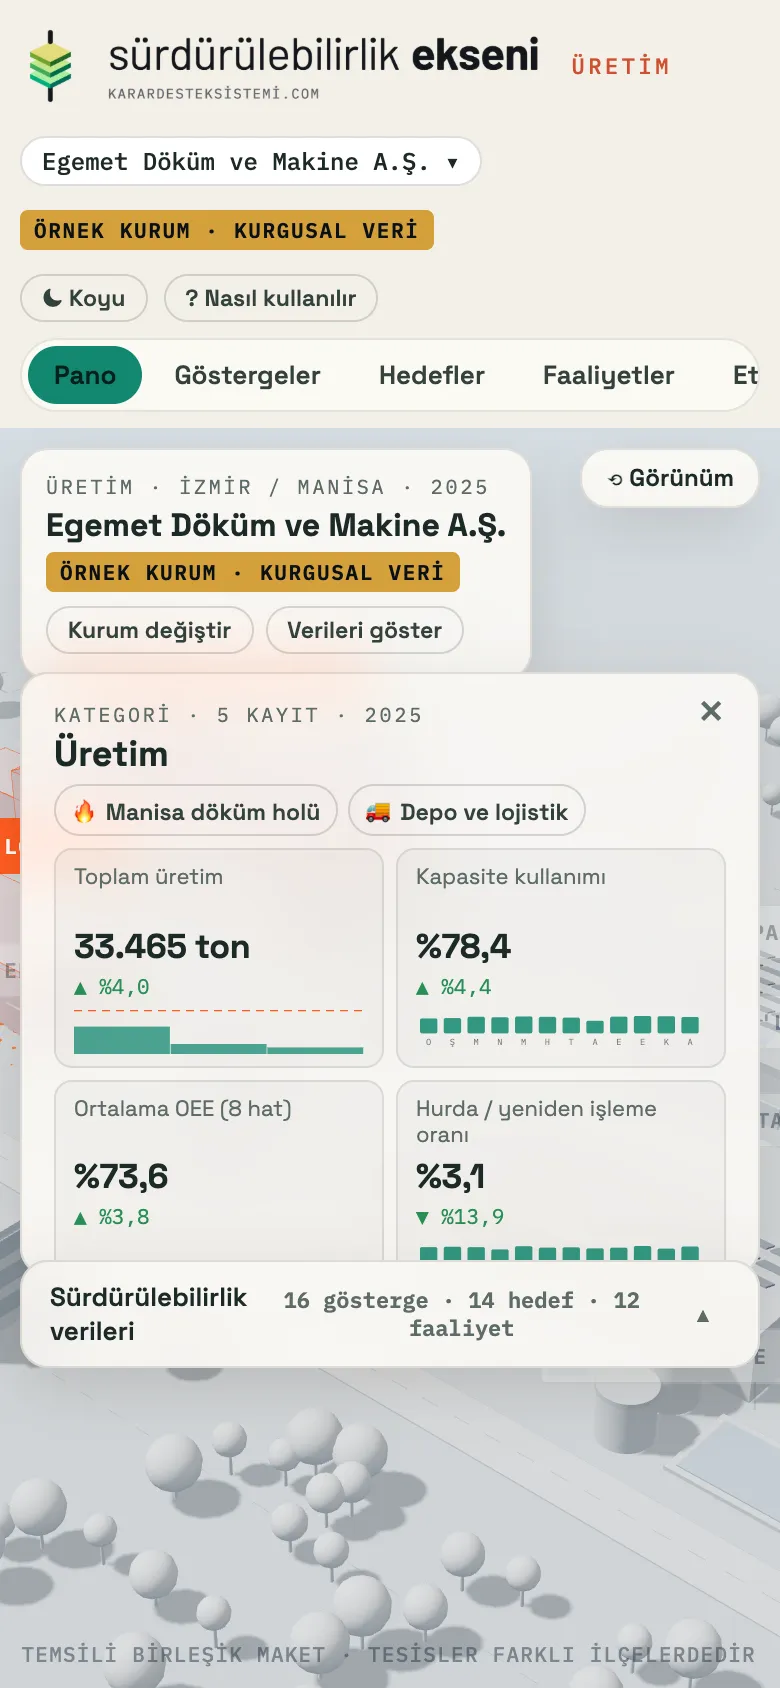
The dashboard, indicators, targets and infographic work the same way at 390 px width. The interface itself is in Turkish.
Eksen supports the preparation, traceability and consistency of the report. The report structure references the GRI Standards and TSRS; it does not replace independent assurance, audit or a compliance assessment. AI produces drafts; a person approves every section.
The screen recordings and images on this page come from the application's fictional sample organisation (Egemet Döküm ve Makine A.Ş.); all values are synthetic.
Eksen's assistant relies only on the data in the report: it answers questions about the data, suggests draft activities to close target gaps, lists conflicting values and maps indicators to reporting frameworks. VITA Lab experts analyse the drafts and final reports, adapt them to the organisation and deliver them with our own touch. Sustainability expertise is led by Dr. Deniz Yıldırım.
Indicator inventory, text drafts and activity suggestions are prepared quickly.
Targets, data and texts are reviewed and properly structured by our subject experts.
The report and infographic are adapted to the organisation's structure and priorities and delivered.