COMPLETED PROJECT · CULTURAL HERITAGE · VIDEO MAPPING
Reflection of 25 Years
Video mapping · Yaşar University 25th-anniversary digital work
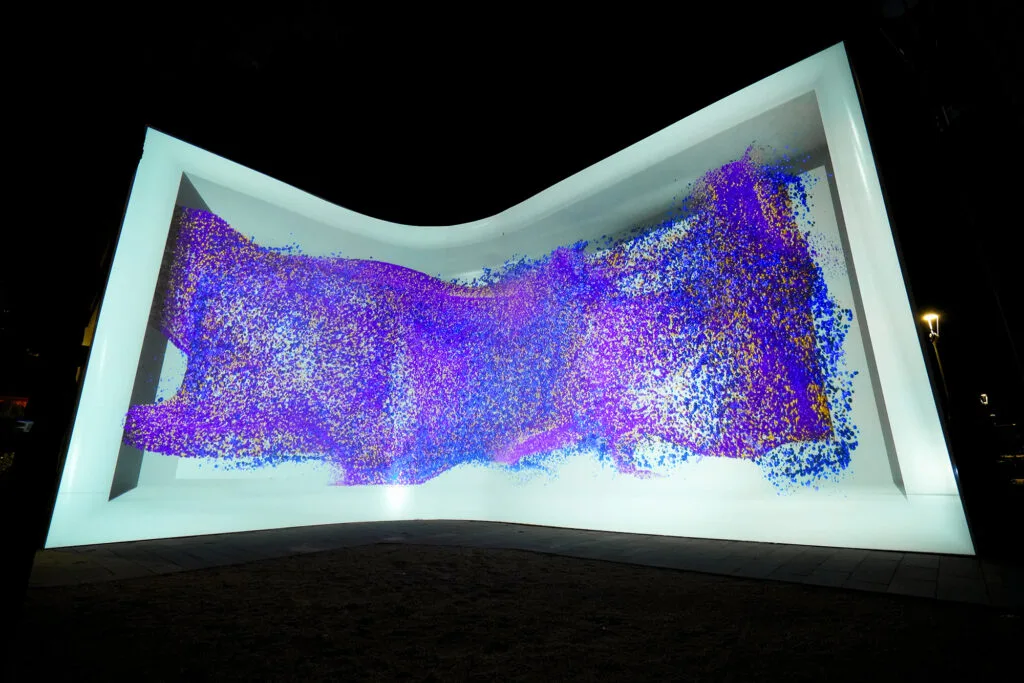
A data work designed not just to tell the story of the university’s quarter century but to make it felt. Twenty-five years of figures become a real-time particle simulation on a 17-metre concave wall.
RESULT
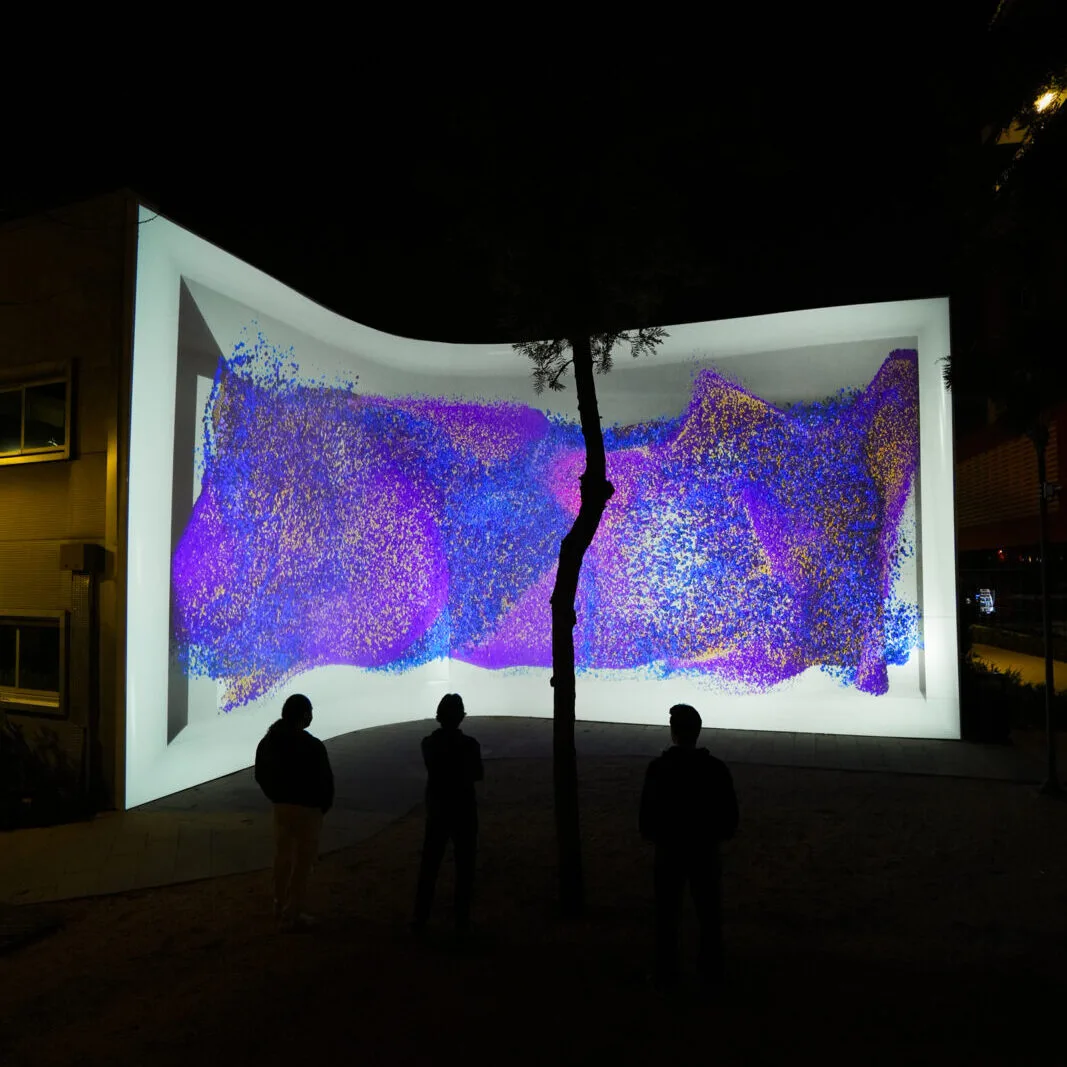
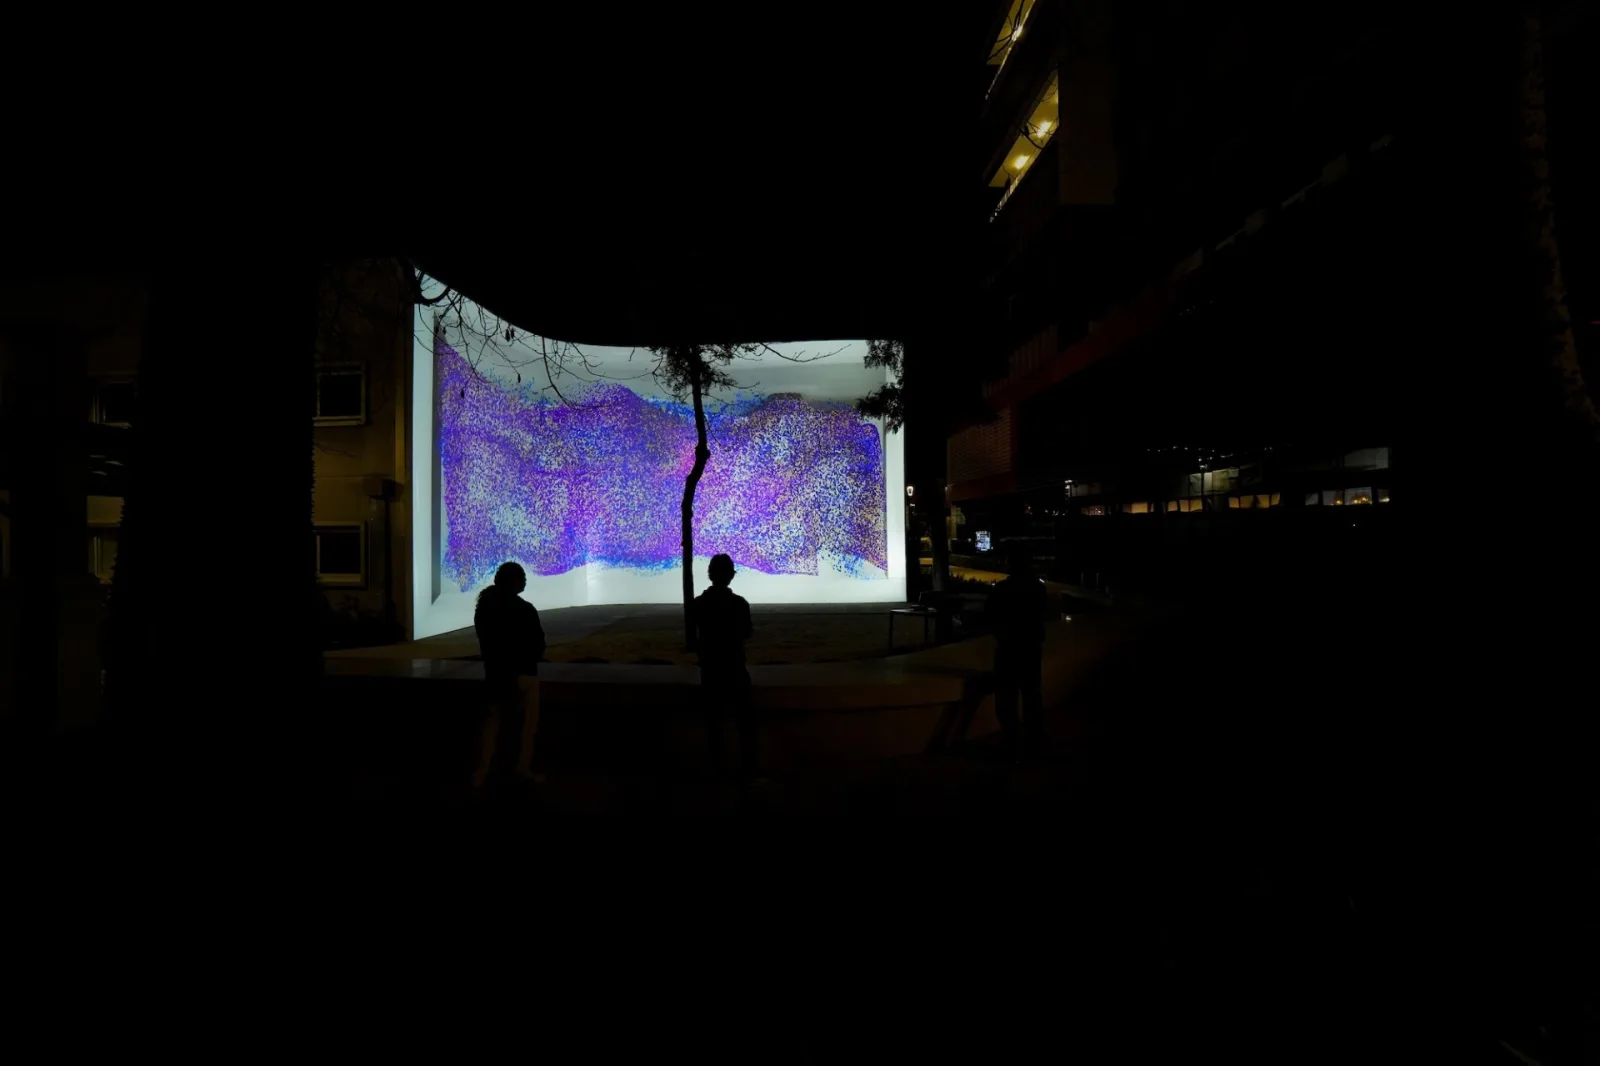
The work was exhibited for Yaşar University's 25th anniversary on a 17-metre concave wall between Block K and Building M on campus.
PARTNERS
Yaşar University · VRLab Creative Studio
SURFACE
17 m × 7 m concave curved wall
VENUE
Between Block K and Building M · Yaşar University campus
The data wasn’t visualised; it became the work itself.
Staff and student numbers, graduates, events, research projects, theses and library use… Rather than being shown as charts, these multi-layered datasets were turned into active parameters that drive the behaviour of the particles.
All the data interact simultaneously; the 25 years are felt not as a linear timeline but as a transformation in which each strand feeds the others.
FROM DATA TO PARTICLE · 25-YEAR TOTALS
Students→ Purple particles52 → 8,400
Staff→ Blue particles50 → 625
Graduates→ Gold particles21,499
Events→ Flow speed4,572
Theses→ Turbulence1,406
Books borrowed→ Sparkle24,085
BAP projects→ Wave pulse155
Sports achievements→ Sparks109
Source: Yaşar University institutional datasets (2002–2026). For staff and students the first and last year values are shown.
03 / TECHNICAL PIPELINE
From Excel to light.
01
DatasetsEXCEL
25 years of institutional data — staff, students, graduates, events, theses, books borrowed, BAP projects and sports achievements — organised by year.
02
From data to signalTOUCHDESIGNER
Each dataset was turned into a control signal spread over time and passed on to drive a free particle system.
03
Real-time simulationUNREAL ENGINE
In Unreal Engine the signals were bound to parameters that set particle count, colour distribution, speed and turbulence in real time.
04
High-quality renderRENDER WORKSTATION
The live simulations were rendered as high-quality particles; a high-spec computer handled brightness, collision and dispersion calculations.
05
ProjectionEPSON EB-PQ2216B · ELPLU03S
A high-lumen laser projector with a short-throw lens covered the 17 m × 7 m concave surface from a single source.
06
Synchronised graphsTOUCHDESIGNER · SECOND MONITOR
Five datasets were produced as synchronised line graphs and shown on an additional monitor in parallel with the simulation.
04 / SYNCHRONISED LINE GRAPHS
Next to the wall, a second screen.
Five datasets were produced as synchronised line graphs in TouchDesigner and shown on an additional monitor in parallel with the simulation, so viewers could read on the side screen why the particles were thickening or speeding up.
STUDENTSSTAFFGRADUATESSPORTS ACHIEVEMENTS · ISPORTS ACHIEVEMENTS · II
05 / SURFACE AND INSTALLATION
Built specifically for the mapping, the surface wraps around the viewer with its two wings and rounded inner corner. A single high-lumen laser projector with a short-throw lens covered the 17-metre surface seamlessly; geometric calibration was done on site with grid tests.